Case study 02 · Data · Backend · Energy
SparkMeter Data Automation
Collects smart-meter readings, keeps a history of corrections and feeds reports, charts and Google Sheets.
- Role
- Architecture, data model, backend, interfaces and testing
- Category
- Data · Backend · Energy
- Stack
- Laravel 13 · Vue 3 · PostgreSQL
01 — Context
The operations team and analysts of a power network tracked SparkMeter smart-meter consumption from exports and Google Sheets, with automations that matched data on subscriber names.
02 — Problem
Tracking relied on subscriber names: a renamed subscriber or a replaced meter broke the reports.
03 — Solution
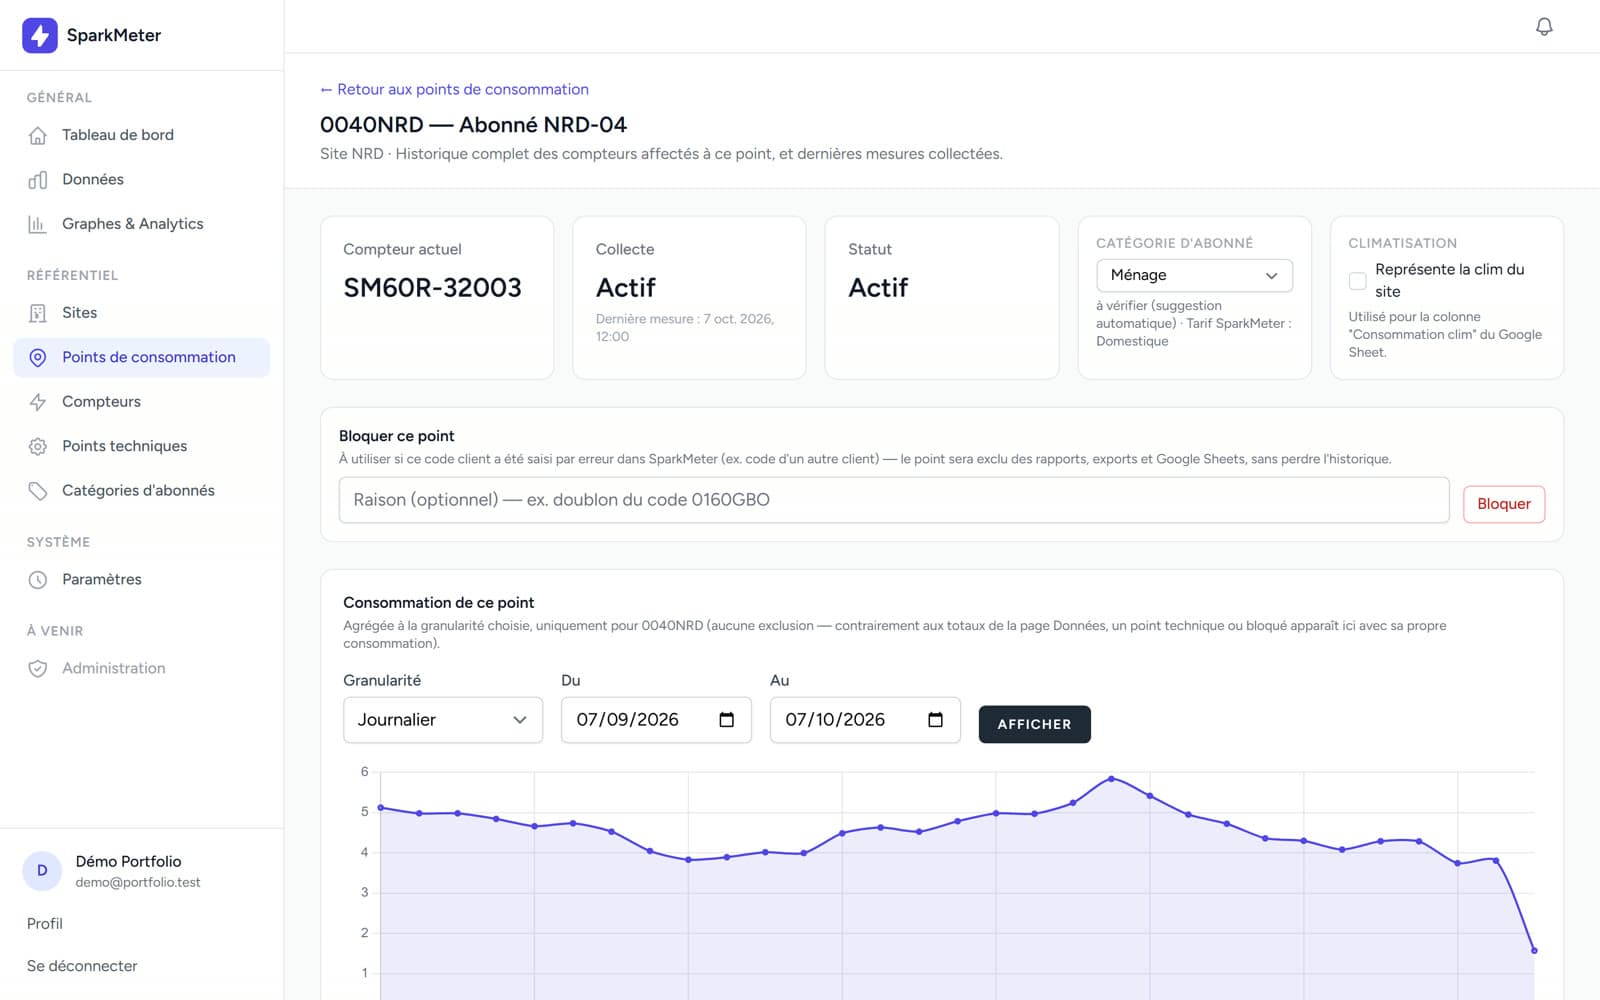
A web application brings collection, the site and meter registry, reports and analytics together. Readings are validated and stored in PostgreSQL, which becomes the reference source. Every consumption point has a stable business code independent of the subscriber's name, and re-collection picks up late corrections while keeping values before and after.
04 — Features
Multi-site collection
SparkMeter CSV import at the native fifteen-minute interval, resuming after the last known day.
Correction history
New readings, unchanged data and corrected values are told apart and traced.
Stable registry
Sites, consumption points and meters, with the assignment history.
Filterable reports
By site, period and subscriber category, from fifteen minutes to a year.
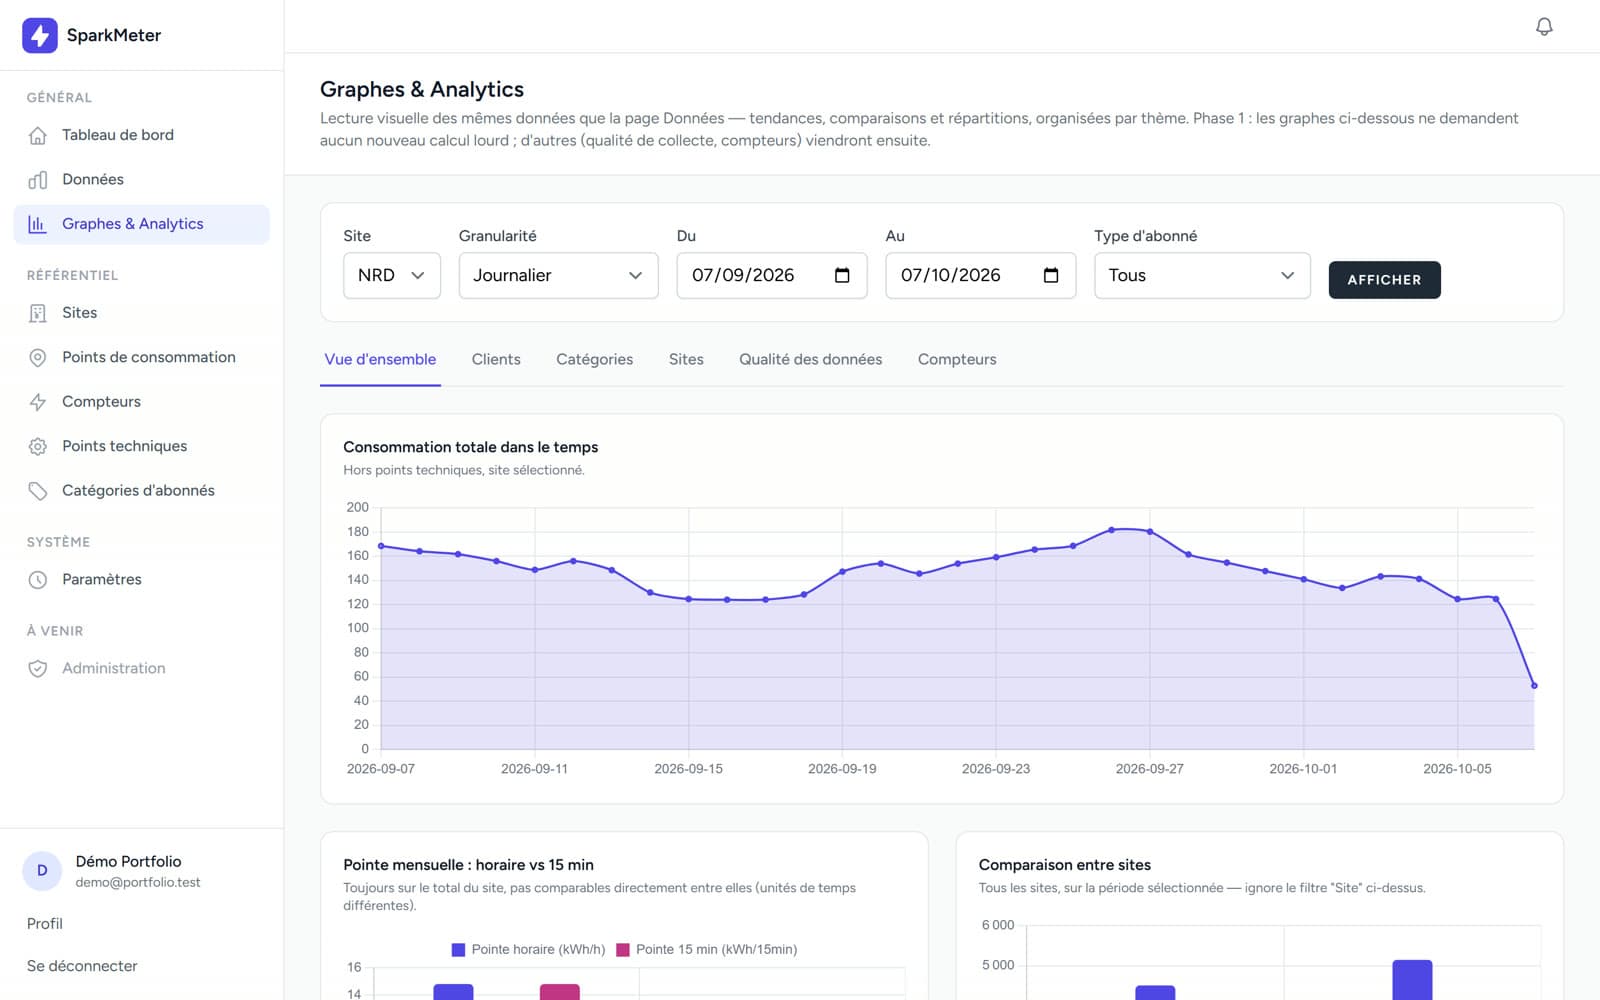
Visual analytics
Curves, site comparison, breakdown by category and Pareto.
Outputs
Google Sheets sync, Excel and CSV exports, source-file archives.
05 — Screenshots
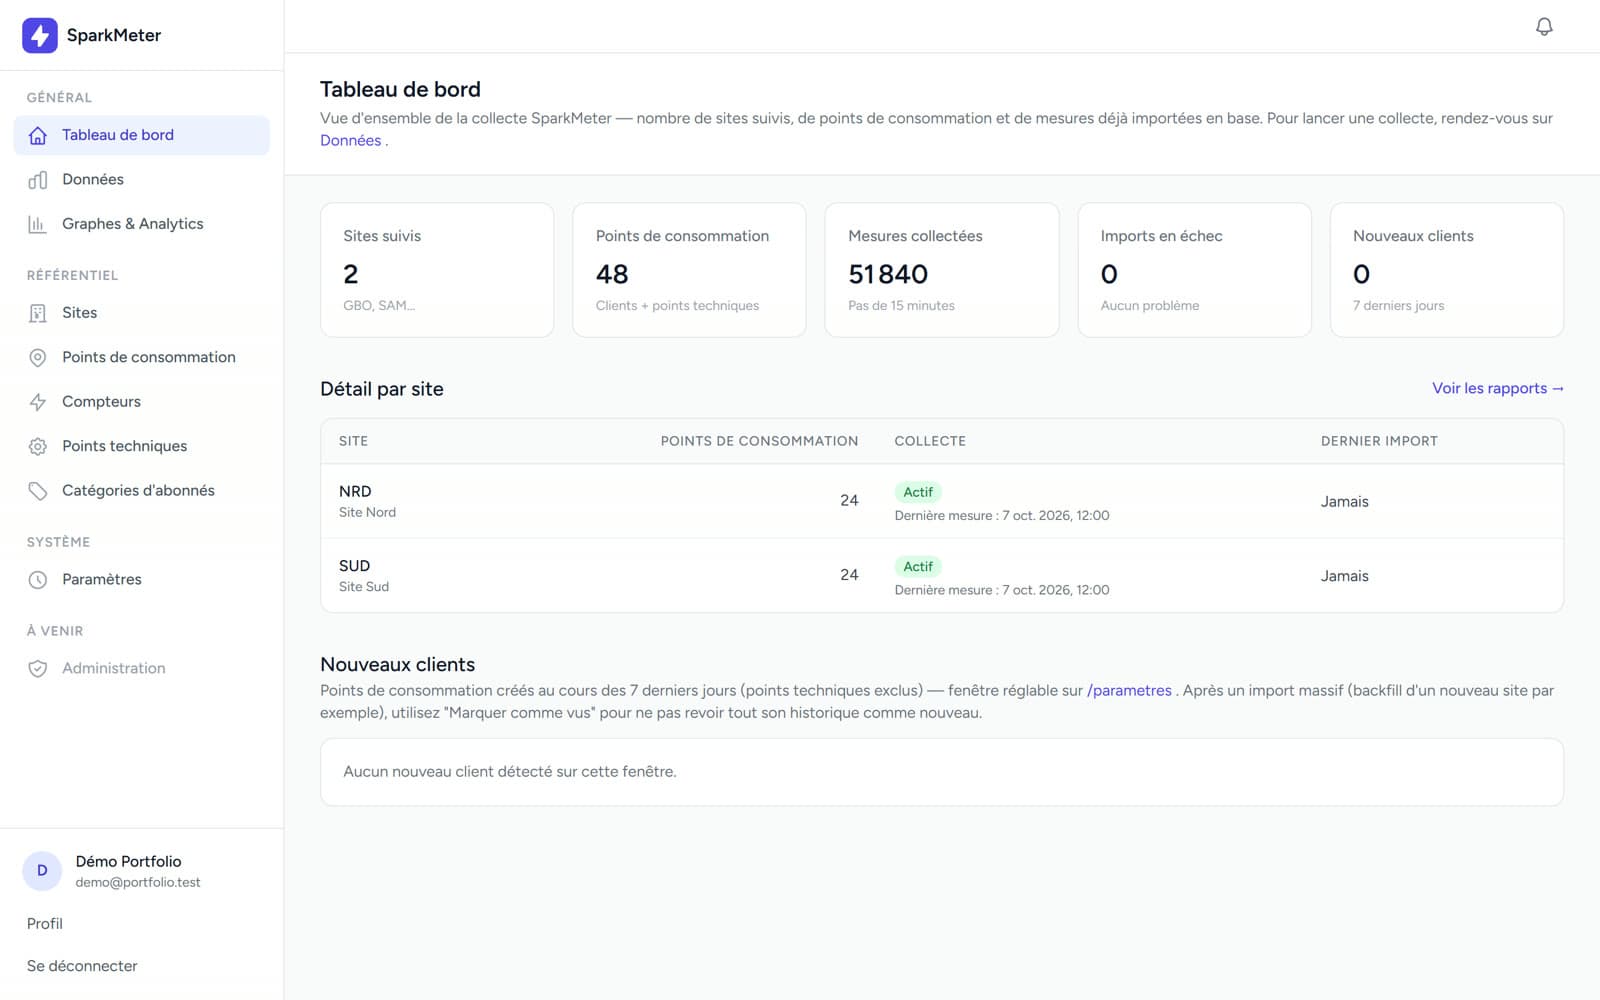
Collection dashboard per site 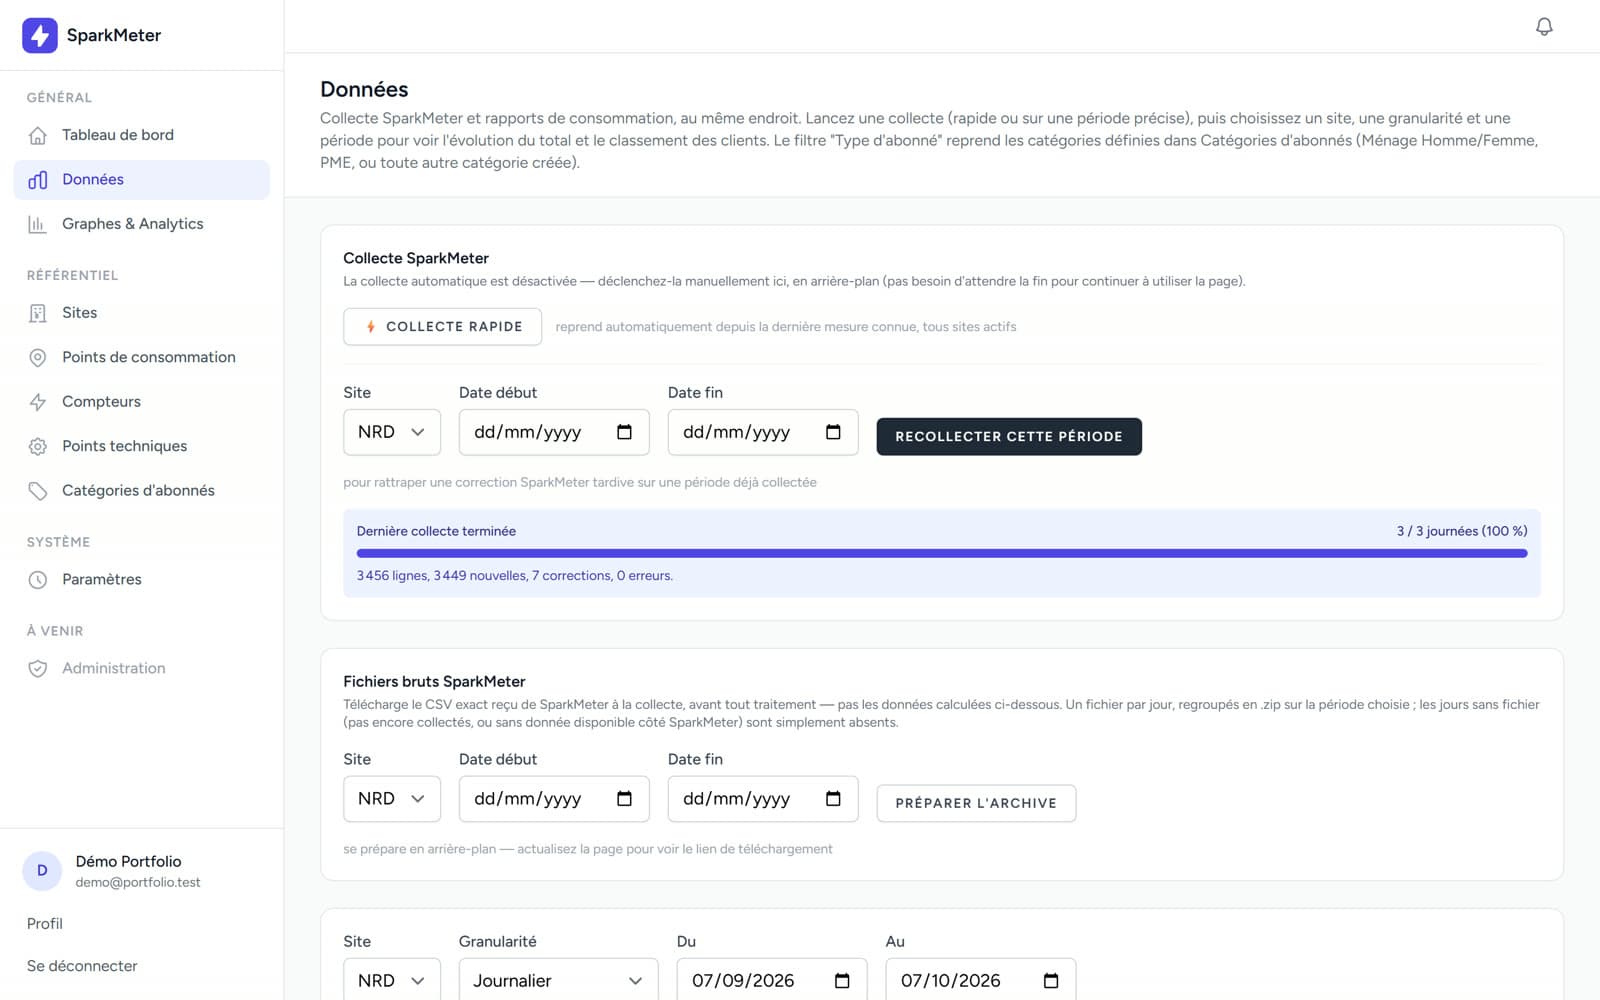
Collection, re-collection and consumption reports
06 — Architecture
- SparkMeter APICSV · multi-site
- Collection & validationjobs · batches · retries
- PostgreSQLreadings · corrections
- Reporting servicesSQL aggregations
- Vue · Sheets · Exceloutputs
The Laravel backend is organised into controllers, domain services, models and jobs; Inertia passes page data to the Vue interface.
Long operations — collection, sync, archives — run as background jobs, and the same aggregation services feed web reports and external outputs.
07 — Technical challenges
Challenge
Keep tracking through meter replacements.
Solution
Consumption point, physical meter and dated assignments kept separate, with a stable business code.
Challenge
Ingest corrections without losing history.
Solution
Point/period uniqueness, comparison on re-collection and before/after values kept.
Challenge
Process long histories without blocking the interface.
Solution
Batch processing, composite indexes, background jobs and per-row PostgreSQL savepoints.
Challenge
Avoid misleading totals.
Solution
Technical meters excluded from totals and rankings while keeping their own views.
08 — My contribution
- Architecture and energy data model
- Laravel backend and Vue / Inertia interfaces
- SparkMeter and Google Sheets API integration
- Collection, validation and reconciliation pipeline
- Asynchronous processing and collection tracking
- Reports, charts and exports
- Query and memory optimisation
- Automated tests
09 — Stack
- Backend
- PHP 8.3, Laravel 13, Eloquent, Jobs & Queues, Scheduler
- Frontend
- Vue 3, Inertia.js 2, Tailwind CSS, Chart.js
- Data
- PostgreSQL, Redis, MinIO (S3)
- Integrations
- API SparkMeter, Google Sheets API, Laravel Excel
- Quality
- PHPUnit, Laravel Pulse, Telescope
10 — Results
15 min
reading interval kept as imported, as close to the source as possible
3
output formats: Google Sheets, Excel and CSV
1
single reference database for reports, charts and spreadsheets